
School admission management software
Analyzing Year-over-Year Application Trends to Forecast School Revenue
A school's revenue for next year is mostly decided by this year's admissions season. Here is how to read application and admission trends class by class, turn them into a revenue forecast, and act early when the numbers turn.
The Onflows team2 min read
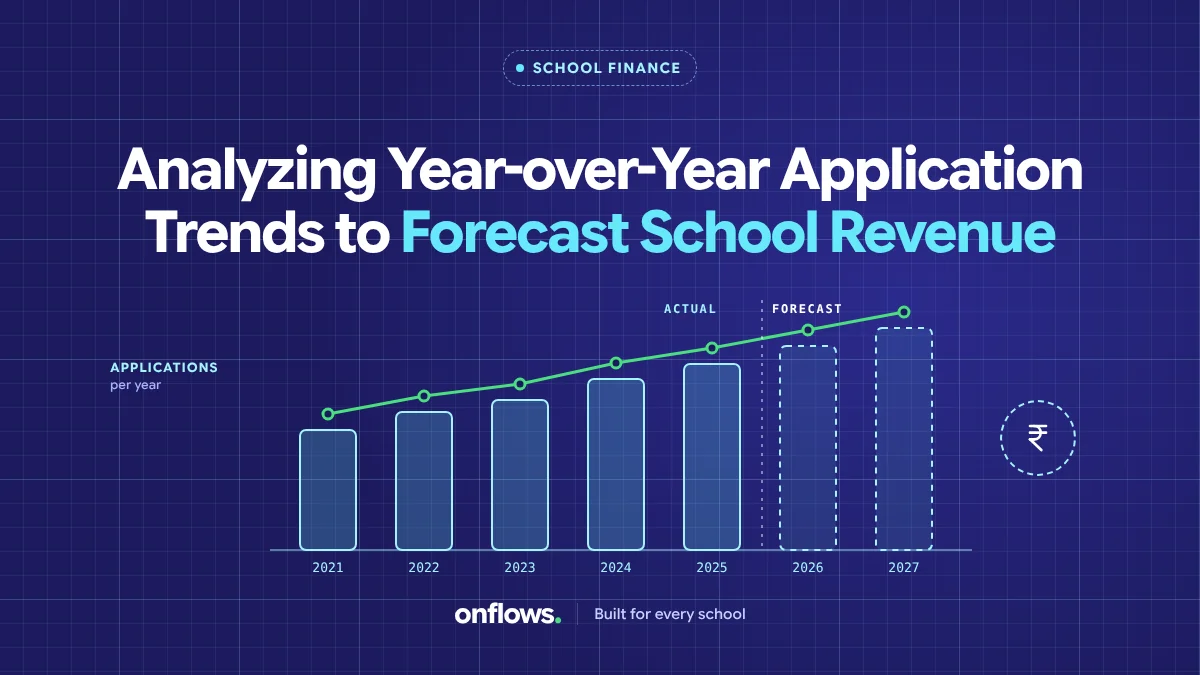
Most of a school's revenue next year is already decided: the students who will stay. The part that is not decided is new admissions and how many students leave. Both show up early in the data, months before the fees arrive.
The numbers to collect
For each class, for each of the last three to five years:
- Inquiries.
- Applications.
- Admissions.
- Students who left at the end of the year.
- Students who continued to the next class.
If your admissions are in software, most of this is a report. If not, a few hours with old registers will get it.
What to look for
The entry classes
Most new admissions happen at entry points: Nursery, Class 1, Class 6, Class 11. These classes drive the trend. A drop in Class 1 applications this year is a smaller Class 1 for the next twelve years.
Conversion rate
Applications to admissions, by year. If applications are steady but conversion is falling, the problem is in your process or your fees, not in demand. See nurturing prospective parents from open house to first payment.
Retention
The percentage of students who continue to the next class. A slow decline in retention costs more than a bad admissions year, because each lost student was paying every year.
Timing
When applications arrive. If they are arriving later each year, families are deciding later, and your follow-up should start later too.
From trend to forecast
A simple forecast for next year:
- Take this year's students in each class.
- Apply last year's retention rate to estimate who continues.
- Add expected new admissions at each class, based on this year's applications and your usual conversion.
- Multiply by next year's fee per class, after typical discounts.
That gives a range, not a number. Use a cautious and an expected case. Discounts matter; see managing discount categories, financial aid and waivers.
When the numbers turn
If the forecast shows a drop:
- Act on the website and the follow-up first. Cheap and fast. See simple website changes that double your online applications.
- Ask families who left why. Exit conversations are the best market research a school has.
- Review costs before the year starts, not after. See monitoring operational costs and stopping budget leakage.
Where Onflows fits
In Onflows, every inquiry and application sits in the admissions list with its status, and closed academic years stay readable in the archives, with promotions recorded. That gives you the history you need for year-on-year comparison. See the features page.
Frequently asked questions
How many years of data do we need?
Three is enough to see a trend. Five is better.
What if we have never tracked inquiries?
Start this season. Next year you will have a baseline.
Should we share the forecast with staff?
Share the trend with leadership and department heads. It helps them plan sections and staffing.
See admissions and archives in Onflows, or create your school.
Topics: School admission management software, Planning, School management software, Costs, Benefits of school ERP software